
Market Update – October 4, 2016
Current Conditions
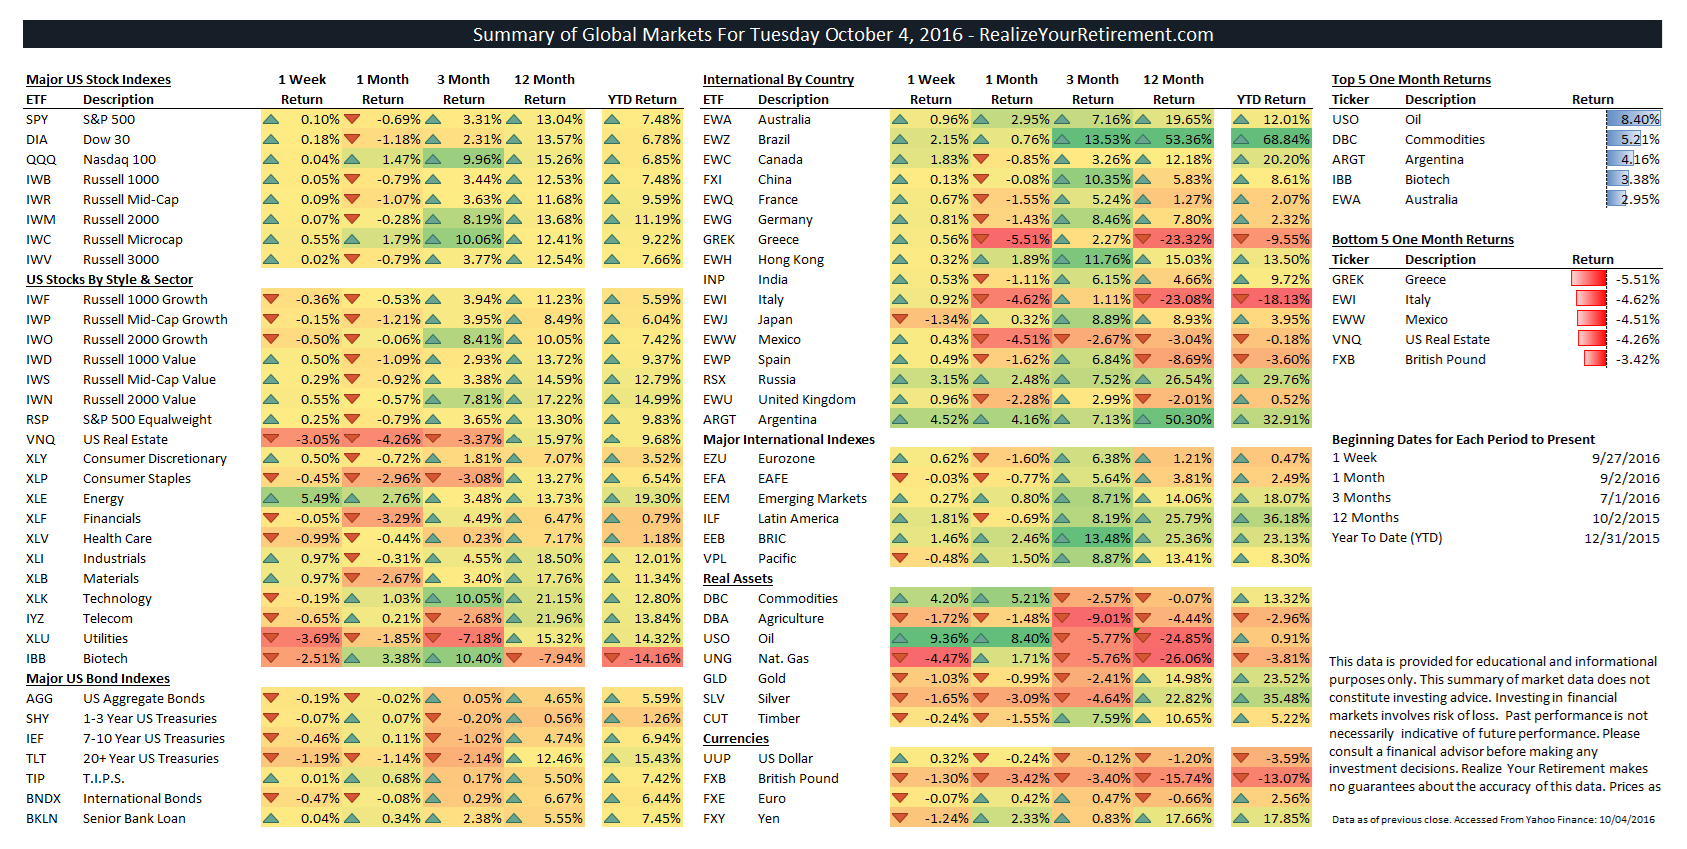
The markets have finished up over the past week with the S&P 500 up 0.1%, the Dow Jones up 0.18%, international stocks (EAFE) down -0.03% and US Aggregate Bonds down -0.19%.
Summary of Global Markets
(Click the Global Markets Summary image to see a larger version.)
Asset Classes
Top asset classes for the past week include Oil (9.36%), Energy (5.49%), and Argentina (4.52%).
Bottom asset classes for the past week include Nat. Gas (-4.47%), Utilities (-3.69%), and US Real Estate (-3.05%).
Top asset classes for the past month include Oil (8.4%), Commodities (5.21%), and Argentina (4.16%).
Bottom asset classes for the past month include Greece (-5.51%), Italy (-4.62%), and Mexico (-4.51%).
Economic Strength Index (ESI)
Updated on a monthly basis. (Chart may not display correctly via email.)
An ESI value of 32% indicates a:
Cautious Outlook
The ESI’s current value of 32% (down from 45%) indicates that the US economy is no longer in prime territory to support growth. While job numbers remain very strong and unemployment remains low several aspects of the US economy have begun to show their age in this market.
The ESI’s move to the low 30’s is a vote of caution. The economy is becoming more vulnerable to shocks. Should the ESI continue to maintain its low value or decline further, the likelihood of a recession will increase.
The levels of several indicators are still in fair territory (with a couple indicators in optimistic territory, mostly job numbers), while others are far below average. Year over year growth rates amongst the indicators underlying the ESI are in the 19th percentile (0 to 100 scale) down from the 21st percentile last month. This, combined with the current value of the ESI imply that we may see more softening of economic numbers to come.
Comments
US markets were fairly flat over this past week, with the Energy sector by far leading other sectors in the markets with a 5.49% gain. This was largely due to optimism over OPEC oil productions cuts and the subsequent gains in oil prices that are assumed to follow.
International stocks fared far better over the past week. Of international markets, emerging markets were the standouts with Argentina (4.52%), Russia (4.15%), and Brazil (2.96%) rallying the most.
Bond classes mostly fell over the past week. Out of the core bond asset classes, 20+ Year Treasuries (-1.19%), International Bonds (-0.47%), and 7-10 Year Treasuries (-0.47%) had the lowest returns.
Note:
I’ll continue this refrain as long as we’re at the top of the markets. It’s easy to become over-allocated to stocks when markets are making new highs and the volatility of the last year is seemingly in the rear-view mirror. However, in times like these (when markets are near their highs or reaching new ones) risk is at its greatest, so it’s important to maintain a balanced outlook in your portfolio.
When volatility increases, as it has in the past few weeks, it’s best to make small changes to your portfolio, with each change moving your portfolio to a more comfortable allocation or to adopt a strategy that does so automatically. Large changes often lead to regret and poor market timing.